Regional Sales
Those are this report's own pages, printed by the engine from the template and the payload below. The workbook is not a picture of them: the tables on those pages arrive as cells you can sort, filter and total, and nothing else comes across.
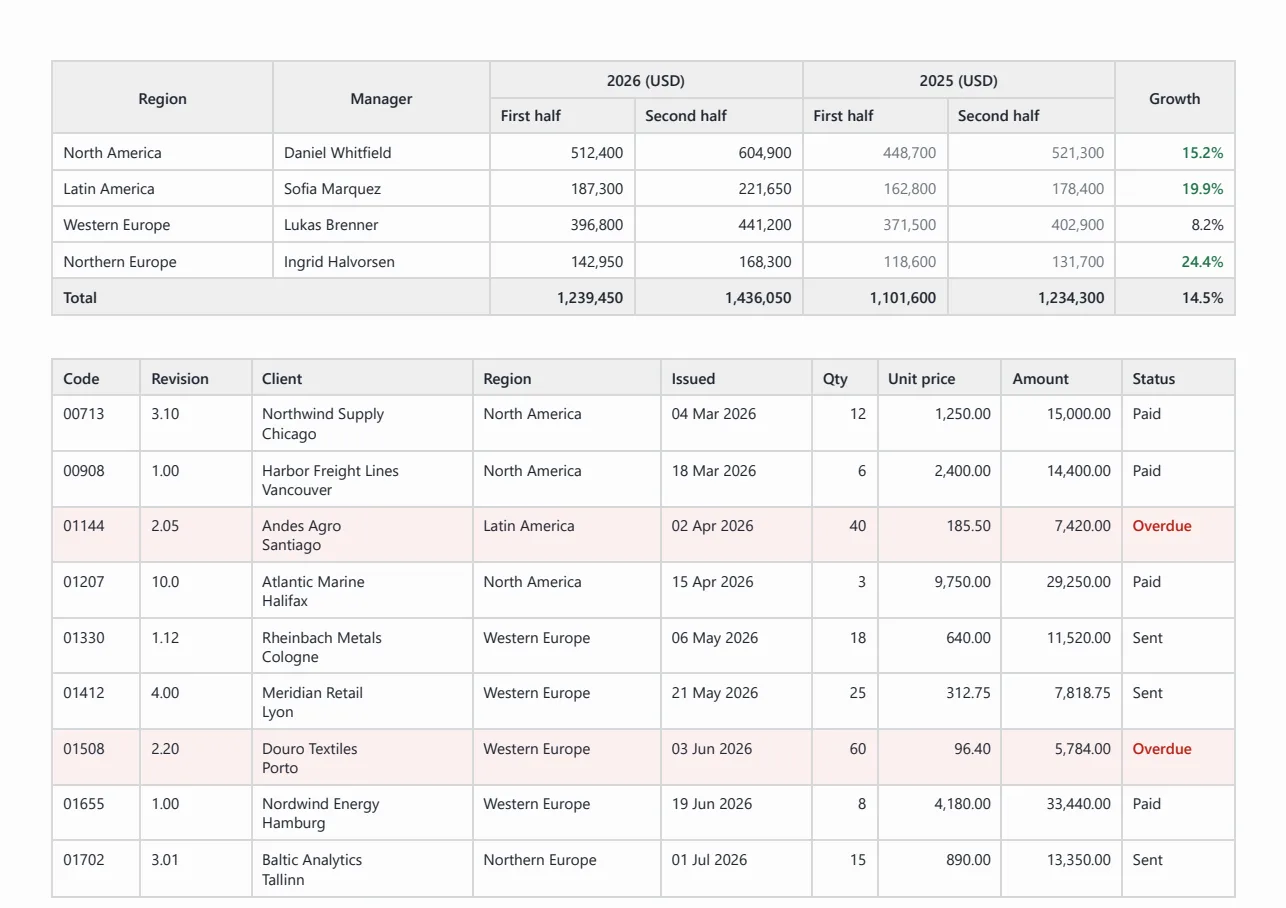
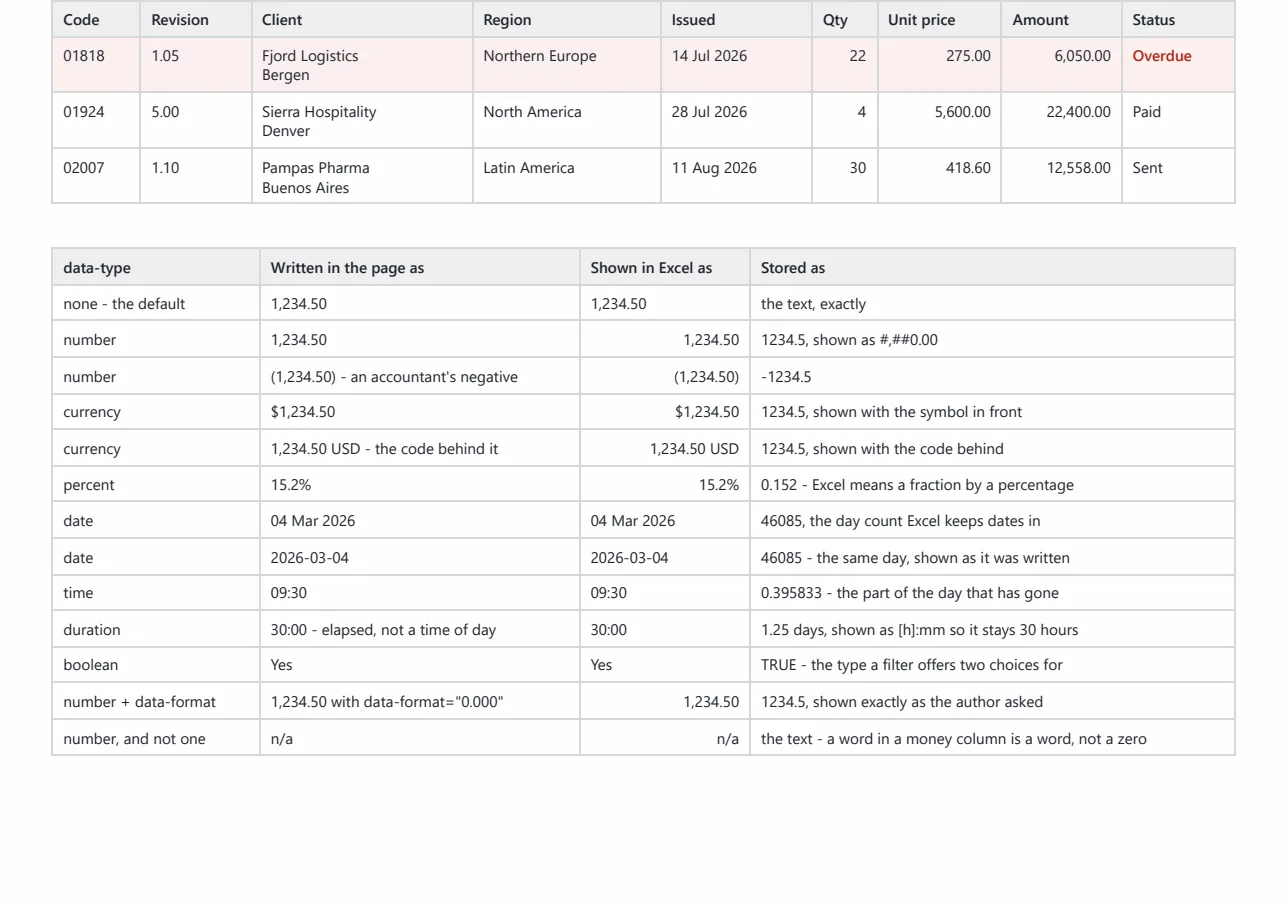
The source
This is the whole thing — the template, the pages that print from it, and the stylesheet
they are dressed in, as HTML with {{ }} bindings. Nothing is generated from a
designer format; what you see here is what the engine renders.
template.html
<!DOCTYPE html>
<html>
  <head>
    <meta charset="utf-8">

    <link rel="stylesheet" href="assets/css/report.css">
  </head>
  <body>

<script id="report-data" type="application/json">{{json}}</script>
  </body>
</html>
page1.html
 <!--
    Sheet one. Two header rows: the year spans two columns across, the region label spans two rows
    down, and both become merged cells. The cells under a rowspan shift right on their own - "First
    half" lands in column C, not column A.

    The header is merged, so this sheet gets frozen panes but no filter: Excel takes a filter over
    merged cells and then behaves oddly, which is worse than not offering one.

    The figures carry data-type, so they arrive as numbers rather than as text that looks like
    numbers - they add up, sort and chart. The header cells above them carry nothing and stay text,
    because "First half" is not a number and declaring a column does not make its label one.
-->
<table data-sheet="Sales by region">
    <thead>
        <tr>
            <th rowspan="2">Region</th>
            <th rowspan="2">Manager</th>
            <th colspan="2">2026 ({{report.currency}})</th>
            <th colspan="2">2025 ({{report.currency}})</th>
            <th rowspan="2">Growth</th>
        </tr>
        <tr>
            <th>First half</th>
            <th>Second half</th>
            <th>First half</th>
            <th>Second half</th>
        </tr>
    </thead>
    <tbody>
        {{#each regions}}
        <tr>
            <td>{{name}}</td>
            <td>{{manager}}</td>
            <td class="num" data-type="number">{{number firstHalf "N0" "en-US"}}</td>
            <td class="num" data-type="number">{{number secondHalf "N0" "en-US"}}</td>
            <td class="num muted" data-type="number">{{number priorFirstHalf "N0" "en-US"}}</td>
            <td class="num muted" data-type="number">{{number priorSecondHalf "N0" "en-US"}}</td>
            <td class="num {{#if (gt growth 10)}}up{{/if}}" data-type="percent">{{number growth "N1" "en-US"}}%</td>
        </tr>
        {{/each}}
    </tbody>
    <!--
        A row of nothing but <th> is a header row wherever it sits, so the total comes out on the
        same band as the header above. Being at the bottom it freezes nothing: only header rows at
        the top of a table do that.
    -->
    <tfoot>
        <tr>
            <th colspan="2">Total</th>
            <th class="num" data-type="number">{{number totals.firstHalf "N0" "en-US"}}</th>
            <th class="num" data-type="number">{{number totals.secondHalf "N0" "en-US"}}</th>
            <th class="num" data-type="number">{{number totals.priorFirstHalf "N0" "en-US"}}</th>
            <th class="num" data-type="number">{{number totals.priorSecondHalf "N0" "en-US"}}</th>
            <th class="num" data-type="percent">{{number totals.growth "N1" "en-US"}}%</th>
        </tr>
    </tfoot>
</table>

<!--
    Sheet two. One header row, nothing merged in it - so this one gets the filter as well as the
    frozen pane, and opens ready to sort and narrow.

    Note which columns say what they are and which deliberately do not. Issued, Qty, Unit price
    and Amount carry data-type and arrive as real dates and numbers. Code and Revision carry
    nothing: "00713" keeps its leading zero and "3.10" stays a revision instead of turning into
    the tenth of March.

    That is the whole reason typing is declared rather than sniffed. An engine guessing at these
    columns would be right about four of them and quietly wrong about two, and a wrong guess
    rewrites data nobody asked it to touch.
-->
<table data-sheet="Invoice lines">
    <thead>
        <tr>
            <th>Code</th>
            <th>Revision</th>
            <th>Client</th>
            <th>Region</th>
            <th>Issued</th>
            <th class="num">Qty</th>
            <th class="num">Unit price</th>
            <th class="num">Amount</th>
            <th>Status</th>
        </tr>
    </thead>
    <tbody>
        {{#each lines}}
        <tr class="{{#if (eq status "Overdue")}}overdue{{/if}}">
            <td>{{code}}</td>
            <td>{{revision}}</td>
            <!-- A <br> inside a cell becomes a line break inside the cell, not a second row. -->
            <td>{{client}}<br>{{city}}</td>
            <td>{{region}}</td>
            <td data-type="date">{{date issuedOn "dd MMM yyyy" "en-GB"}}</td>
            <td class="num" data-type="number">{{quantity}}</td>
            <td class="num" data-type="currency">{{report.currency}} {{number unitPrice "N2" "en-US"}}</td>
            <td class="num" data-type="currency">{{report.currency}} {{number amount "N2" "en-US"}}</td>
            <td>{{status}}</td>
        </tr>
        {{/each}}
    </tbody>
</table>

<!--
    Sheet three. Every kind a cell can be declared, what the page shows, and what the workbook
    actually stores - which is the thing worth checking, because the two are not the same and the
    difference is the entire point.

    Read this one in Excel with the formula bar open: the middle column is what you see and the
    right-hand column says what is underneath it. Click a cell in the middle column and the formula
    bar shows the stored value, not the text.
-->
<table data-sheet="Cell types">
    <thead>
        <tr>
            <th>data-type</th>
            <th>Written in the page as</th>
            <th>Shown in Excel as</th>
            <th>Stored as</th>
        </tr>
    </thead>
    <tbody>
        <tr>
            <td>none - the default</td>
            <td>1,234.50</td>
            <td>1,234.50</td>
            <td>the text, exactly</td>
        </tr>
        <tr>
            <td>number</td>
            <td>1,234.50</td>
            <td class="num" data-type="number">1,234.50</td>
            <td>1234.5, shown as #,##0.00</td>
        </tr>
        <tr>
            <td>number</td>
            <td>(1,234.50) - an accountant's negative</td>
            <td class="num" data-type="number">(1,234.50)</td>
            <td>-1234.5</td>
        </tr>
        <tr>
            <td>currency</td>
            <td>$1,234.50</td>
            <td class="num" data-type="currency">$1,234.50</td>
            <td>1234.5, shown with the symbol in front</td>
        </tr>
        <tr>
            <td>currency</td>
            <td>1,234.50 USD - the code behind it</td>
            <td class="num" data-type="currency">1,234.50 USD</td>
            <td>1234.5, shown with the code behind</td>
        </tr>
        <tr>
            <td>percent</td>
            <td>15.2%</td>
            <td class="num" data-type="percent">15.2%</td>
            <td>0.152 - Excel means a fraction by a percentage</td>
        </tr>
        <tr>
            <td>date</td>
            <td>04 Mar 2026</td>
            <td data-type="date">04 Mar 2026</td>
            <td>46085, the day count Excel keeps dates in</td>
        </tr>
        <tr>
            <td>date</td>
            <td>2026-03-04</td>
            <td data-type="date">2026-03-04</td>
            <td>46085 - the same day, shown as it was written</td>
        </tr>
        <tr>
            <td>time</td>
            <td>09:30</td>
            <td data-type="time">09:30</td>
            <td>0.395833 - the part of the day that has gone</td>
        </tr>
        <tr>
            <td>duration</td>
            <td>30:00 - elapsed, not a time of day</td>
            <td data-type="duration">30:00</td>
            <td>1.25 days, shown as [h]:mm so it stays 30 hours</td>
        </tr>
        <tr>
            <td>boolean</td>
            <td>Yes</td>
            <td data-type="boolean">Yes</td>
            <td>TRUE - the type a filter offers two choices for</td>
        </tr>
        <tr>
            <td>number + data-format</td>
            <td>1,234.50 with data-format="0.000"</td>
            <td class="num" data-type="number" data-format="0.000">1,234.50</td>
            <td>1234.5, shown exactly as the author asked</td>
        </tr>
        <tr>
            <td>number, and not one</td>
            <td>n/a</td>
            <td class="num" data-type="number">n/a</td>
            <td>the text - a word in a money column is a word, not a zero</td>
        </tr>
    </tbody>
</table>
assets/css/report.css
/*
    None of this reaches the workbook. Excel takes the tables and writes the cells; the styling of
    a sheet is the engine's own - bold headers on a band, thin borders, frozen panes, columns
    widened to their text. What this file is for is the preview, so the report can be read and
    checked on the page before anyone opens the file it produces.
*/

body {
    margin: 0;
    padding: 14mm 12mm;
    font-family: "Segoe UI", system-ui, sans-serif;
    font-size: 10pt;
    color: #1f2430;
}

table {
    width: 100%;
    margin-bottom: 10mm;
    border-collapse: collapse;
}

/* Repeated on every printed page, and the reason a long table stays readable when it breaks. */
thead {
    display: table-header-group;
}

tr {
    break-inside: avoid;
}

th,
td {
    padding: 1.8mm 2.4mm;
    border: 1px solid #d9d9d9;
    text-align: start;
    vertical-align: top;
}

/* The same grey band the sheet uses, so the preview and the workbook agree about what a header is. */
th {
    background: #efefef;
    font-weight: 600;
}

thead th {
    text-align: center;
}

/*
    A header that spans both rows of the header sits in the middle of them rather than pinned to
    the top of the first - Region, Manager and Growth, which label the whole two-row band. Excel
    reads this the same way the page does, so the merged cell is centred there too.
*/
thead th[rowspan] {
    vertical-align: middle;
}

thead tr:last-child th,
tbody td {
    text-align: start;
}

.num {
    text-align: end;
    font-variant-numeric: tabular-nums;
}

/* Last year, kept for comparison rather than for reading. */
.muted {
    color: #6b7280;
}

.up {
    color: #217346;
    font-weight: 600;
}

.overdue td {
    background: #fdf2f2;
}

.overdue td:last-child {
    color: #b42318;
    font-weight: 600;
}
shared-assets/css/house.css
/*
  The project's house style: what every report in it looks like before it looks like itself.

  It is in shared-assets rather than in a report because it is the project's, not one report's —
  the palette, the type, the sheet, the running header, and the handful of parts (card, chip, pill,
  meter, table) that every report here is assembled from. A report's own stylesheet composes these
  into its layout; it does not redecide what a card is.

  A template references it as assets/css/house.css, exactly as it references its own files. The
  shared folder is searched behind the report's own, so the path means the same thing in every
  report — and a report that needs its own version keeps a file at that path and wins.
*/

:root
{
  /* Named for the job, not the hue, so a rebrand is this block and nothing else. */
  --ink: #0f172a;
  --ink-soft: #475569;
  --ink-faint: #6b7a90;
  --ink-invert: #ffffff;

  --page: #ffffff;
  --panel: #ffffff;
  --panel-2: #f8fafc;
  --rule: #e2e8f0;
  --rule-soft: #eef2f7;

  --brand: #0b1f3a;
  --brand-2: #12325c;
  --accent: #1d4ed8;
  --accent-soft: #eef3ff;
  --cyan: #0ea5e9;

  --good: #047857;
  --good-soft: #e7f6f0;
  --warn: #b45309;
  --warn-soft: #fdf3e3;
  --bad: #b91c1c;
  --bad-soft: #fdeceb;
  --idle: #64748b;
  --idle-soft: #f1f5f9;

  --radius: 7px;
  --radius-sm: 4px;
}

body
{
  margin: 0;
  color: var(--ink);
  background: var(--page);

  /*
    No Arabic face here, and no Arabic font in shared-assets at all. Naming one for every report in
    the project meant seven reports asked for a typeface none of them loads, so what they actually
    printed in was the second name in the list. The one Arabic report carries the family and the
    files itself.
  */
  font-family: "Segoe UI", Tahoma, sans-serif;
  font-size: 11px;
  line-height: 1.55;

  /* Every figure in this project is read down a column, so digits are the same width. */
  font-variant-numeric: tabular-nums;
  -webkit-font-smoothing: antialiased;
}

/*
  The sheet.

  The engine prints with no page margin, so the edges are the report's own to leave. Cloned decoration
  keeps the padding on every sheet a long page runs onto rather than only the first, and the top
  padding is what the fixed running header sits in — it reserves no room of its own.
*/
.sheet
{
  box-sizing: border-box;
  width: 794px;
  min-height: 1123px;
  padding: 96px 40px 44px;

  -webkit-box-decoration-break: clone;
  box-decoration-break: clone;
}

/* ---------- the running header, on every sheet ---------- */

/*
  The engine fixes #report-page-header to the top of the sheet; everything below is this project's
  band inside it. A band rather than a line of text: it is the first thing on every page and the
  only thing carrying the mark, and at 76px it is still under a fifteenth of the sheet.
*/
#report-page-header
{
  height: 76px;
  background: linear-gradient(105deg, var(--brand) 0%, var(--brand-2) 62%, #17416f 100%);
  color: var(--ink-invert);
}

.masthead
{
  display: flex;
  align-items: center;
  gap: 14px;
  height: 73px;
  padding: 0 40px;
  box-sizing: border-box;
}

/* The accent edge, under the band. Three pixels is enough to read as deliberate. */
#report-page-header::after
{
  content: "";
  display: block;
  height: 3px;
  background: linear-gradient(to left, var(--accent), var(--cyan) 55%, rgba(14, 165, 233, 0));
}

.masthead .logo
{
  width: 30px;
  height: 30px;
  flex: 0 0 auto;
}

.masthead .titles
{
  display: flex;
  flex-direction: column;
  gap: 1px;
  min-width: 0;
}

.masthead .org
{
  font-size: 12.5px;
  font-weight: 700;
  letter-spacing: -.005em;
}

.masthead .subject
{
  font-size: 10.5px;
  color: #a9c2e0;
}

.masthead .meta
{
  margin-inline-start: auto;
  display: flex;
  flex-direction: column;
  align-items: flex-end;
  gap: 2px;
  text-align: end;
  white-space: nowrap;
}

.masthead .period
{
  font-size: 11px;
  font-weight: 600;
}

/* A quiet outline rather than a filled badge: it is a caveat, not a headline. */
.masthead .classification
{
  padding: 1px 7px;
  border: 1px solid rgba(255, 255, 255, .34);
  border-radius: 999px;
  font-size: 9px;
  color: #cddcee;
}

/* ---------- the page's own heading, under the band ---------- */

.pagehead
{
  display: flex;
  align-items: flex-end;
  gap: 12px;
  padding-bottom: 9px;
  border-bottom: 1px solid var(--rule);
}

.pagehead h1
{
  margin: 0;
  font-size: 19px;
  font-weight: 700;
  letter-spacing: -.015em;
}

.pagehead .lede
{
  margin: 3px 0 0;
  color: var(--ink-soft);
  font-size: 10.5px;
}

.pagehead .stamp
{
  margin-inline-start: auto;
  color: var(--ink-faint);
  font-size: 10px;
  white-space: nowrap;
}

/* ---------- parts ---------- */

.card
{
  box-sizing: border-box;
  padding: 12px 14px 10px;
  background: var(--panel);
  border: 1px solid var(--rule);
  border-radius: var(--radius);
}

.card-head
{
  display: flex;
  align-items: baseline;
  gap: 8px;
  margin-bottom: 8px;
}

.card h2
{
  margin: 0;
  font-size: 12.5px;
  font-weight: 700;
}

.card .note
{
  margin-inline-start: auto;
  color: var(--ink-faint);
  font-size: 9.5px;
  white-space: nowrap;
}

/* A chart draws itself left to right whatever the page does, and its own labels sit inside it. */
.chart
{
  width: 100%;
  direction: ltr;
}

.chip
{
  display: inline-flex;
  align-items: center;
  gap: 4px;
  padding: 1px 7px;
  border-radius: 999px;
  font-size: 9.5px;
  font-weight: 700;
  line-height: 1.7;
  white-space: nowrap;
}

.chip--good { background: var(--good-soft); color: var(--good); }
.chip--bad  { background: var(--bad-soft);  color: var(--bad); }
.chip--warn { background: var(--warn-soft); color: var(--warn); }
.chip--idle { background: var(--idle-soft); color: var(--idle); }

/*
  A status, as a word with a dot rather than as a filled block: eight of them down a table column
  would otherwise be eight blocks of colour competing with the figures beside them.
*/
.pill
{
  display: inline-flex;
  align-items: center;
  gap: 5px;
  font-size: 10px;
  font-weight: 600;
  white-space: nowrap;
}

.pill::before
{
  content: "";
  width: 7px;
  height: 7px;
  border-radius: 50%;
  background: currentColor;
  flex: 0 0 auto;
}

.pill--good { color: var(--good); }
.pill--warn { color: var(--warn); }
.pill--bad  { color: var(--bad); }
.pill--idle { color: var(--idle); }
.pill--done { color: var(--accent); }

/*
  A proportion, drawn rather than written. Vector, so it stays sharp where a canvas would not — the
  small measures are the ones a reader leans in on.
*/
.meter
{
  height: 5px;
  border-radius: 3px;
  background: var(--rule-soft);
  overflow: hidden;
}

.meter > span
{
  display: block;
  height: 100%;
  border-radius: 3px;
  background: var(--accent);
}

.meter--good > span { background: var(--good); }
.meter--warn > span { background: var(--warn); }
.meter--bad  > span { background: var(--bad); }

/* ---------- tables ---------- */

/*
  Fixed layout and a header group, which is the pair that keeps a long table on the sheet: without
  the first, columns size to their content and the far one runs off the paper; without the second,
  a table that paginates leaves the next sheet as unlabelled columns of numbers.
*/
table.grid
{
  width: 100%;
  table-layout: fixed;
  border-collapse: collapse;
  font-size: 10.5px;
}

table.grid thead { display: table-header-group; }

table.grid tr { break-inside: avoid; }

/*
  Border-box, because a fixed layout takes the width it is given as the whole column: with padding
  added on top instead, six columns quietly cost another 96px and the one column left on auto pays
  for all of it.
*/
table.grid th,
table.grid td { box-sizing: border-box; }

table.grid th
{
  padding: 6px 8px;
  background: var(--panel-2);
  border-bottom: 1px solid var(--rule);
  color: var(--ink-soft);
  font-size: 9.5px;
  font-weight: 700;
  text-align: start;
  white-space: nowrap;
}

table.grid td
{
  padding: 6px 8px;
  border-bottom: 1px solid var(--rule-soft);
  vertical-align: middle;
  overflow-wrap: break-word;
}

table.grid tbody tr:last-child td { border-bottom: 0; }

.num
{
  text-align: end;
  font-weight: 600;
}

/* ---------- the foot of the page ---------- */

.footnote
{
  margin-top: 12px;
  padding-top: 8px;
  border-top: 1px solid var(--rule);
  color: var(--ink-faint);
  font-size: 9.5px;
}

/*
  The running footer, which the browser draws rather than the page.

  It is a document of its own at print time: this stylesheet is read and sent along with it, so type
  and layout arrive, but nothing it would have to fetch does — no webfont, no image, no background.
  So it is set in whatever face the renderer has, and kept to figures and a code, which read the same
  in any of them.
*/
.pagefoot
{
  display: flex;
  align-items: center;
  justify-content: space-between;
  width: 100%;
  padding: 0 40px;
  box-sizing: border-box;
  color: #8a97a8;
  font-family: "Segoe UI", Arial, sans-serif;
  font-size: 8.5px;
  letter-spacing: .04em;
}
What it carries
Stylesheets, scripts, images and fonts travel inside the report, so nothing is resolved
from the outside while it renders. Anything under shared-assets/ belongs to
the project rather than to this report — held once for every report in it, and reached
from the template at the same assets/… path as the report's own.